|
en ru |
Stream
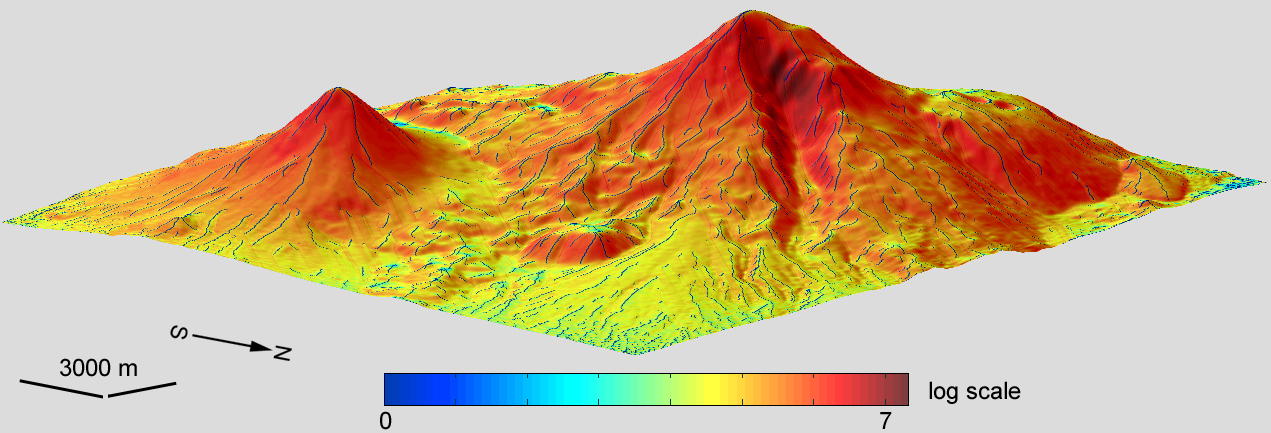
power index (SI)* takes into account data on catchment area and slope
gradient:
where
CA and G are catchment
area and slope gradient, respectively. Stream
power index can be used to describe potential flow erosion at the given point
of the topographic surface. As catchment area and slope gradient increase,
the amount of water contributed by upslope areas and the velocity of water
flow increase, hence stream power index and erosion risk increase. Like other combined morphometric
variables, stream power index can be derived from a digital elevation model (DEM)
by the sequential application of methods for local and nonlocal morphometric
characteristics, followed by an arithmetic combination of the results of
these calculations. Example**. A model of stream power index was derived from a
DEM of Mount Ararat. CA
was calculated by the Martz–de Jong method adapted to spheroidal equal angular grids; G was calculated by the universal spectral
analytical method. The
model includes 779,401 points
(the matrix 1081 x 721); the grid spacing is 1". The vertical
exaggeration of the 3D model is 2x. The data processing and modelling were carried out using the software Matlab R2008b and LandLord 4.0. |
|
|
DIGITAL TERRAIN ANALYSIS IN SOIL SCIENCE AND GEOLOGY 2nd revised edition I.V. Florinsky Elsevier / Academic Press, 2016 Amsterdam, 486 p. ISBN 978-0-12-804632-6 |